Projects
To create your first project you'll need to go to Projects in the top menu bar.
- Click
Create Project - Enter a project name like "South Denver Aquaponics"
- Select the project type
Aquaponics - Enter a project location like "Denver, CO"
- Go down to
Select a Project Templateand choose theAquaponics Starter Kit
Congratulations! Your project is ready. What that did was setup your standard operation procedures, notebooks, metrics, and your weather. You're officially ready to start growing!
What is a project type?
Different types of projects require a different user interface. Depending on your choice, the application will change to fit whichever metrics or trends you're trying accomplish with that particular project. These projects fit into three categories:
- Aquaculture: your focus is on fish and water quality. You don't need information about VPD or other metrics. You need to focus more on water quality parameters.
- Hydroponics: your focus is on plant production. Water quality is very important but you also need a general understanding of your air temperatures and other environmental factors.
- Aquaponics: your balancing the cultivation of fish with the production of plants and need an informative interface that gives you what you need to maintain that balance.
What are project templates?
Project templates are an extremely powerful and extensible solution to a complex problem. We've partnered with the world's leading experts in next-gen farming to provide tools, operation procedures, fish and crop libraries for your projects.
When setting up your project you can simply search for the project template you want to install, and install it with just one click. After you've installed that template, you can visit your project to find all the recommended actions for your farm.
Why are my charts not available?
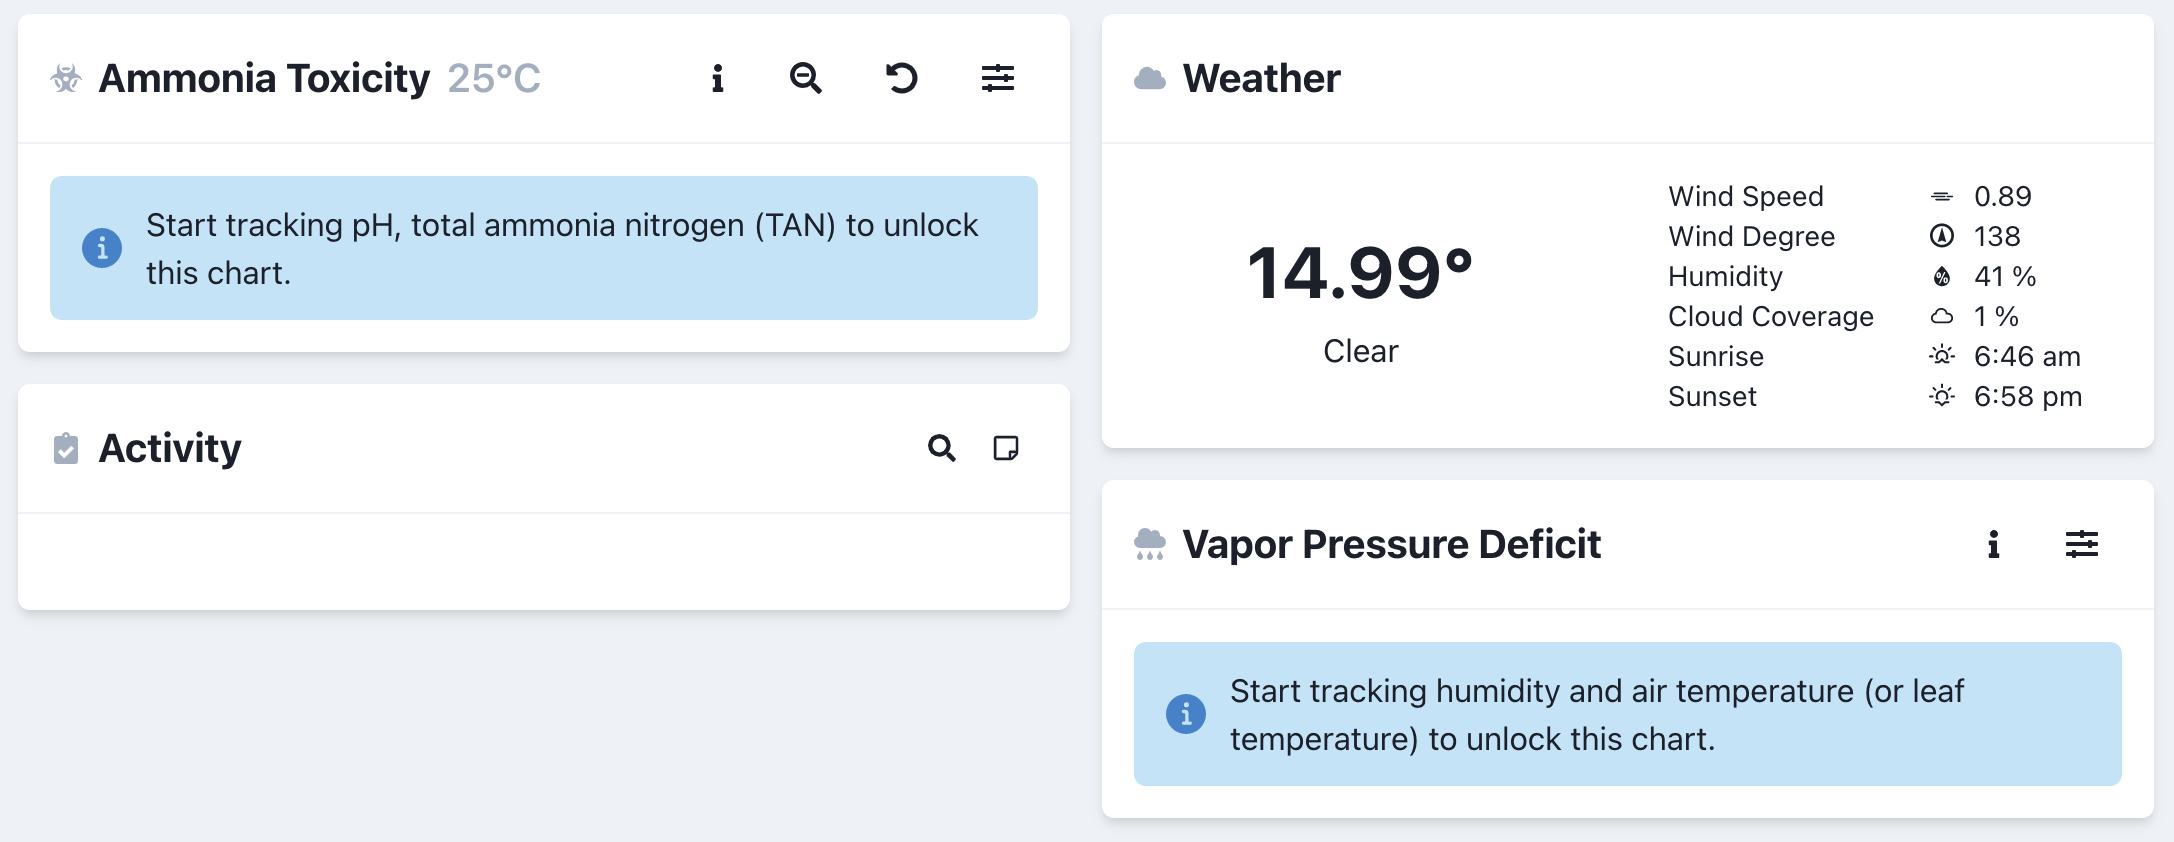
If you see indicators on your charts, this simply means you haven't started entering data that is required by this chart. Once you start tracking the data it will show up with charts and insights that you can interact with.