The Basics
When transitioning from a traditional notebook to FarmHub, it's good to get to know a few terminology shifts. These concepts are extremely powerful and versatile and will help you isolate and analyze your data in new and insightful ways.
Terminology
Projects
Projects are the core components of FarmHub. We define a project as a single hydroponic, aquaponic, or aquaculture system.
RECOMMENDATIONS
Decoupled Aquaponics: We would recommend setting up two projects: one project for your hydroponics side and one for your aquaculture side.
Pond Culture: We would recommend setting up each individual pond as its own project to isolate the health metrics of each pond.
Notebooks
Think about your traditional notebook or spreadsheet-- it may look something like this:
| Date | pH | EC | DO | Temperature (C) |
|---|---|---|---|---|
| 2020/01/01 | 7 | 0.7 | 8 | 27 |
| 2020/01/02 | 6.8 | 0.8 | 7 | 26.6 |
In this format we would treat each column as its own individual notebook. You would create four separate notebooks for pH, EC, DO and Temperature respectively. It would look something like this in your dashboard:
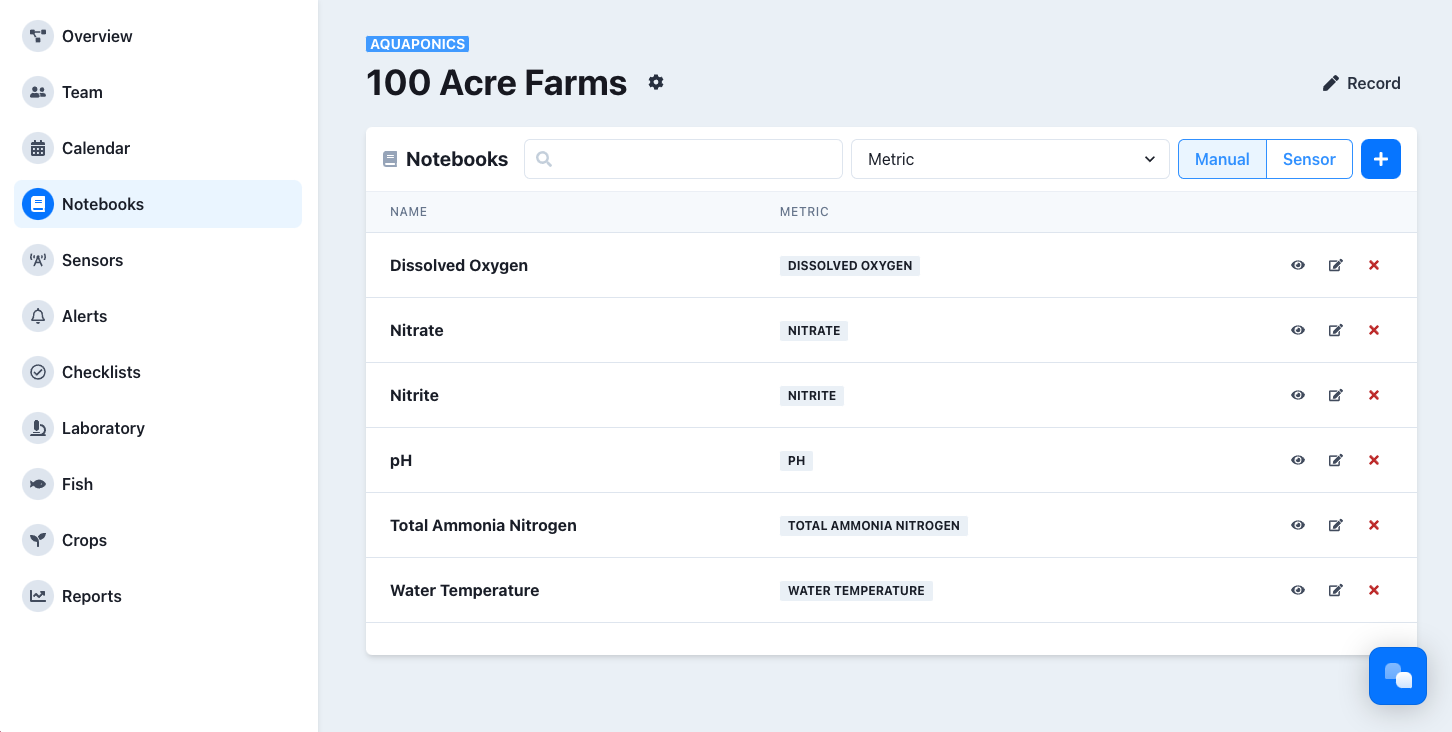
There are a few key reasons why segmenting your data with notebooks can very versatile and powerful:
- A spreadsheet requires that everything be tested on the same day for a single row. With the level of segmentation in your dashboard you can enter data as you see fit.
- Notebooks enable integration with sensors for continuous readings (more on that in a later module).
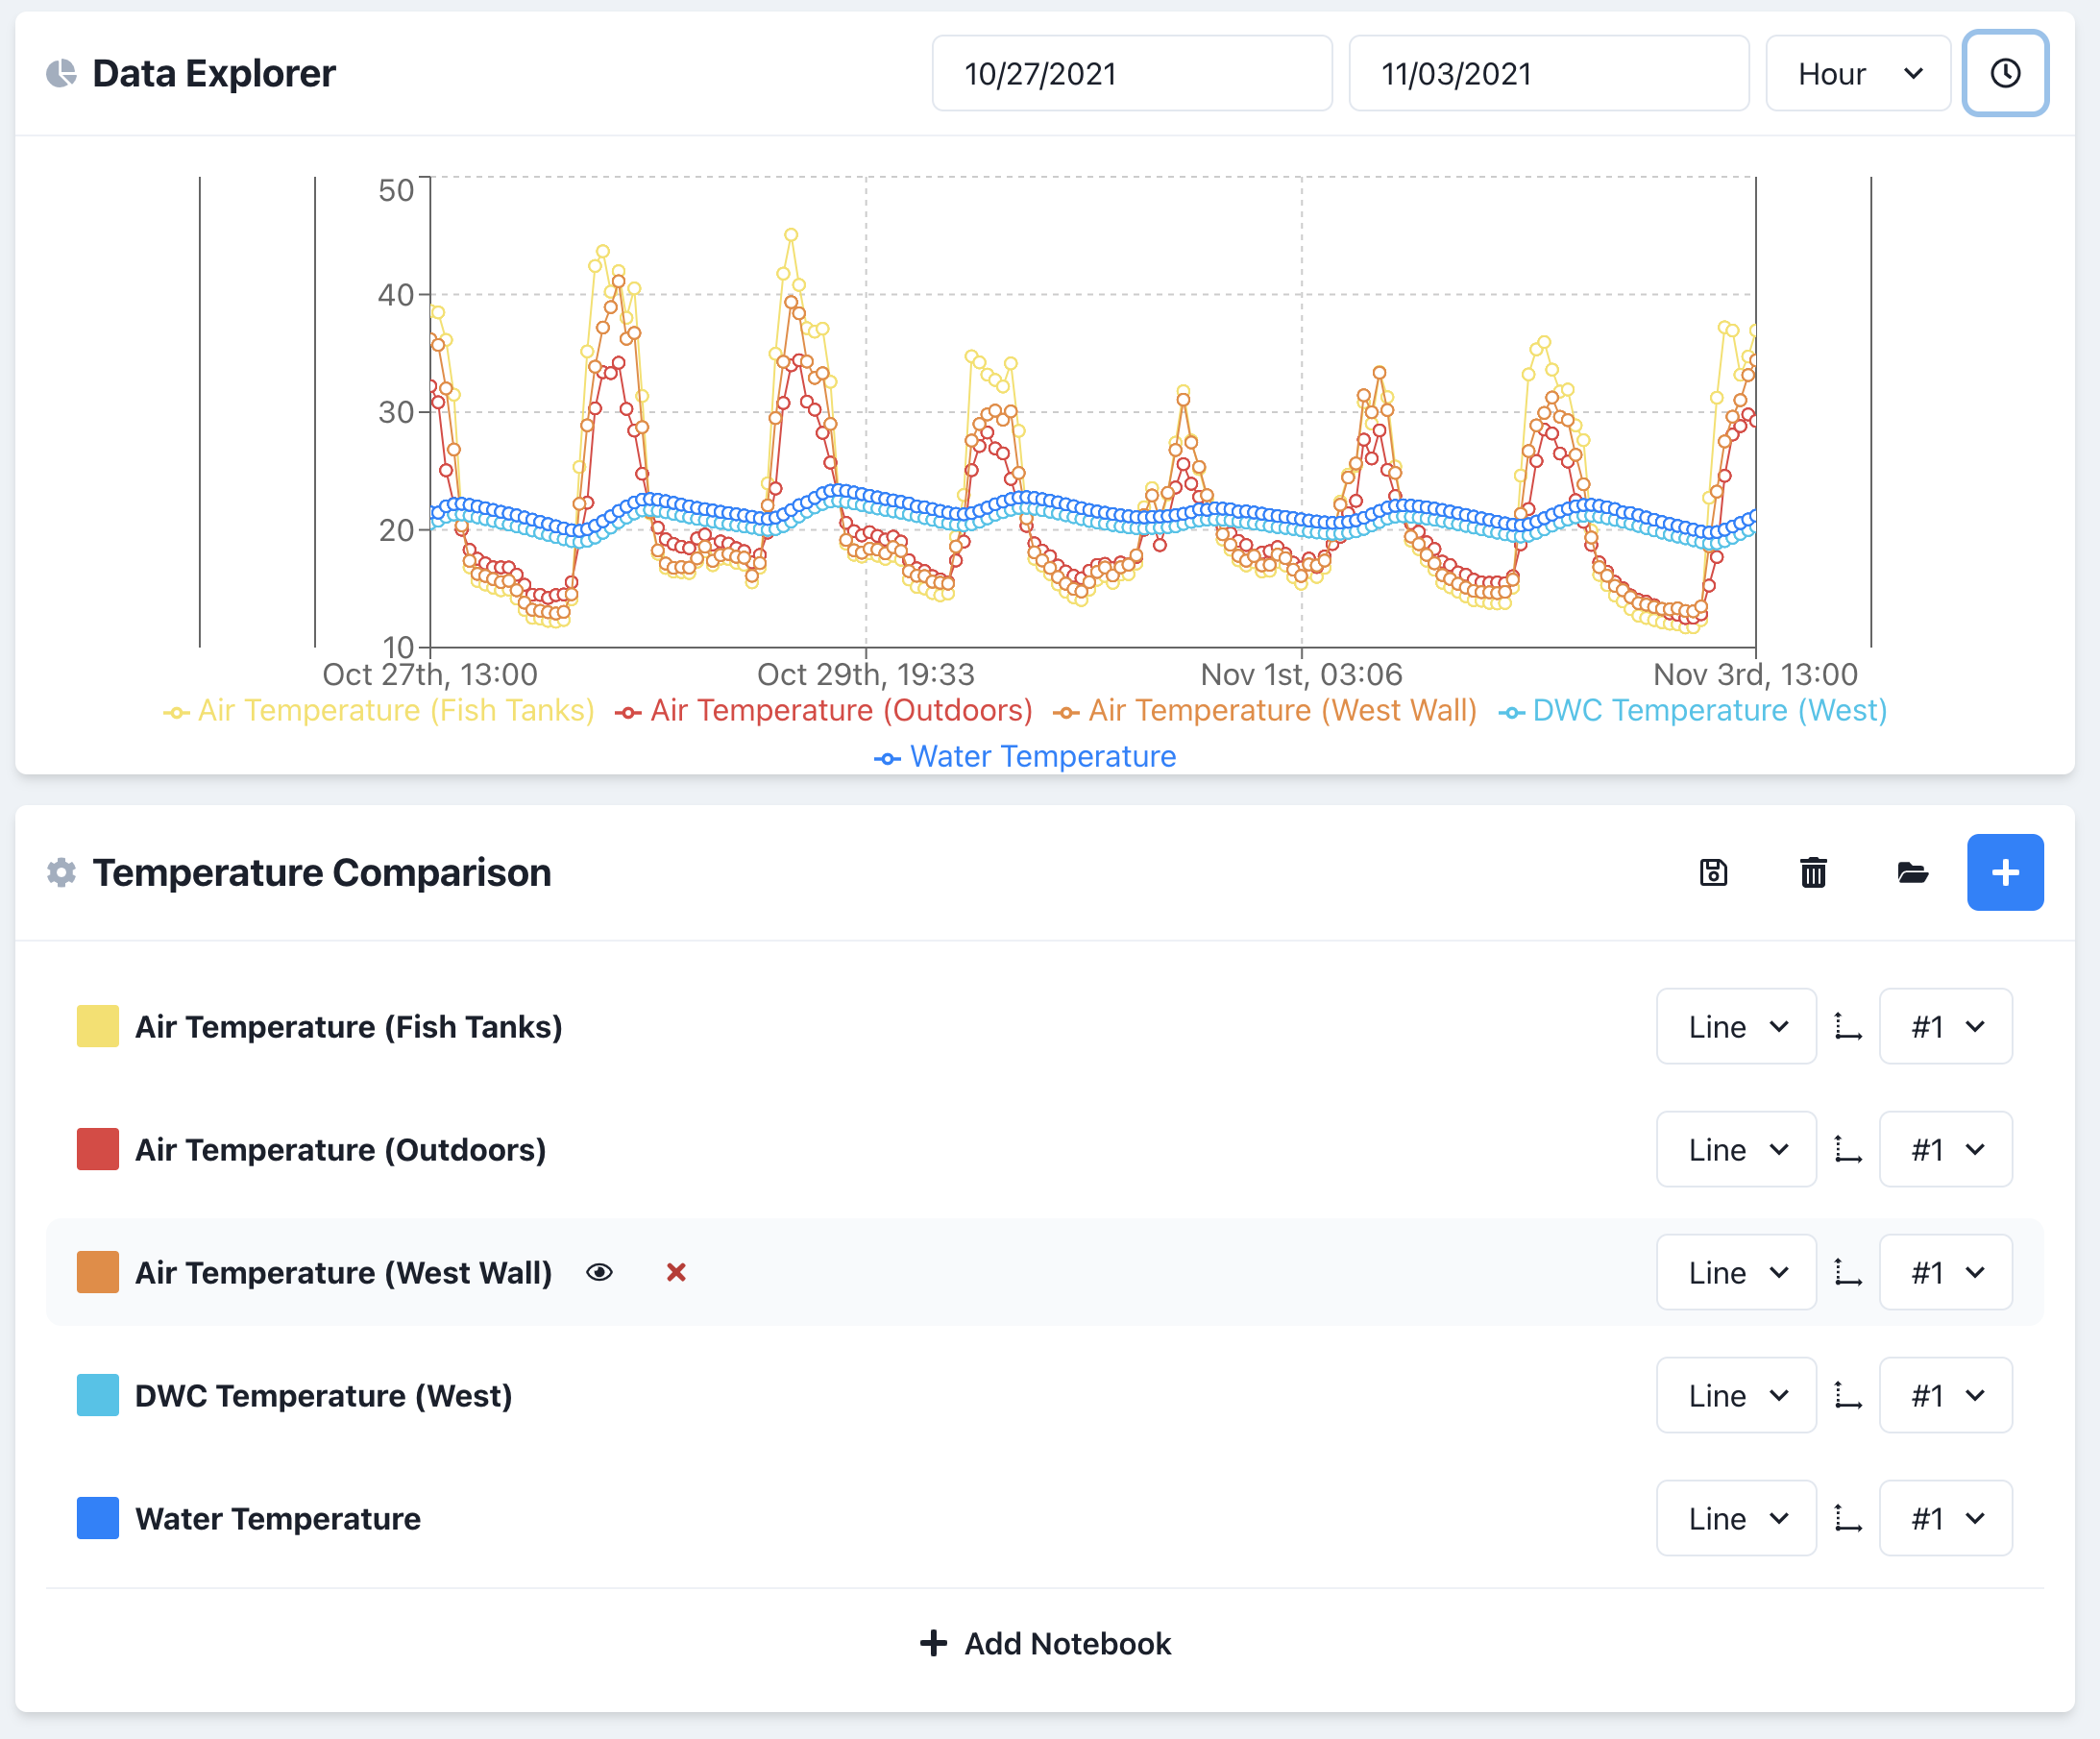
- Notebooks enable the isolation, analysis, and exporting of a specific metric's historical data.
Metrics
A metric is a quantitative measurement that can be tracked over time. We currently support the following metrics (and are always adding more):
Supported Metrics
- Alkalinity
- Aluminum
- Ammonia
- Ammonium
- Ammonium Nitrogen
- Arsenic
- Barometric Pressure
- Bicarbonates
- Boron
- BRIX
- Bromide
- Calcium
- Carbonate Hardness
- Carbon Dioxide
- Carbon/Nitrogen Ratio
- Chloride
- Chlorine
- Chromium
- Cobalt
- Copper
- Daily Light Integral
- Dissolved Oxygen
- Electrical Conductivity
- Flow Rate
- Fluoride
- General Hardness
- Height
- Indoor Air Temperature
- Indoor Relative Humidity
- Infrared Light
- Iron
- Kilowatt
- Kilowatt Hours
- Lead
- Length
- Magnesium
- Manganese
- Molybdenum
- Nickel
- Nitrate
- Nitrate Nitrogen
- Nitrate Nitrogen / Ammonium Nitrogen / Sulfur Ratio
- Nitrite
- Nitrogen
- Outdoor Air Temperature
- Outdoor Relative Humidity
- Oxygen
- Oxygen Reduction Potential
- pH
- Phosphate
- Phosphorus
- Photosynthetic Active Radiation
- Photosynthetic Photon Flux
- Photosynthetic Photon Flux Density
- Potassium
- Potassium / Calcium / Magnesium / Phosphorus Ratio
- Potassium / Calcium Ratio
- Pressure
- Quantity
- Salinity
- Selenium
- Silicon
- Sodium
- Sodium Absorption Ratio
- Strontium
- Sulfate
- Sulfates
- Sulfur
- Total Ammonia Nitrogen
- Total Dissolved Solids
- Total Nitrogen
- Total Sugars
- Visible Light
- Volume
- Water Level
- Water Temperature
- Watts
- Weight
- Yield Photon Flux
- Zinc
Sensors
Here at FarmHub we define a sensor as any IoT connected device transmitting up to 10 metrics. We support almost any sensor, programming language, and method of data entry.
In other words, an indvidual (1) sensor is:
- A BlueLab Guardian sending pH, EC & Temperature
- An Atlas Scientific sensor sending pH, EC, Temperature, Water Temperature, Humidity
- A custom Raspberry Pi sending water quality parameters
Sections
Projects Overview
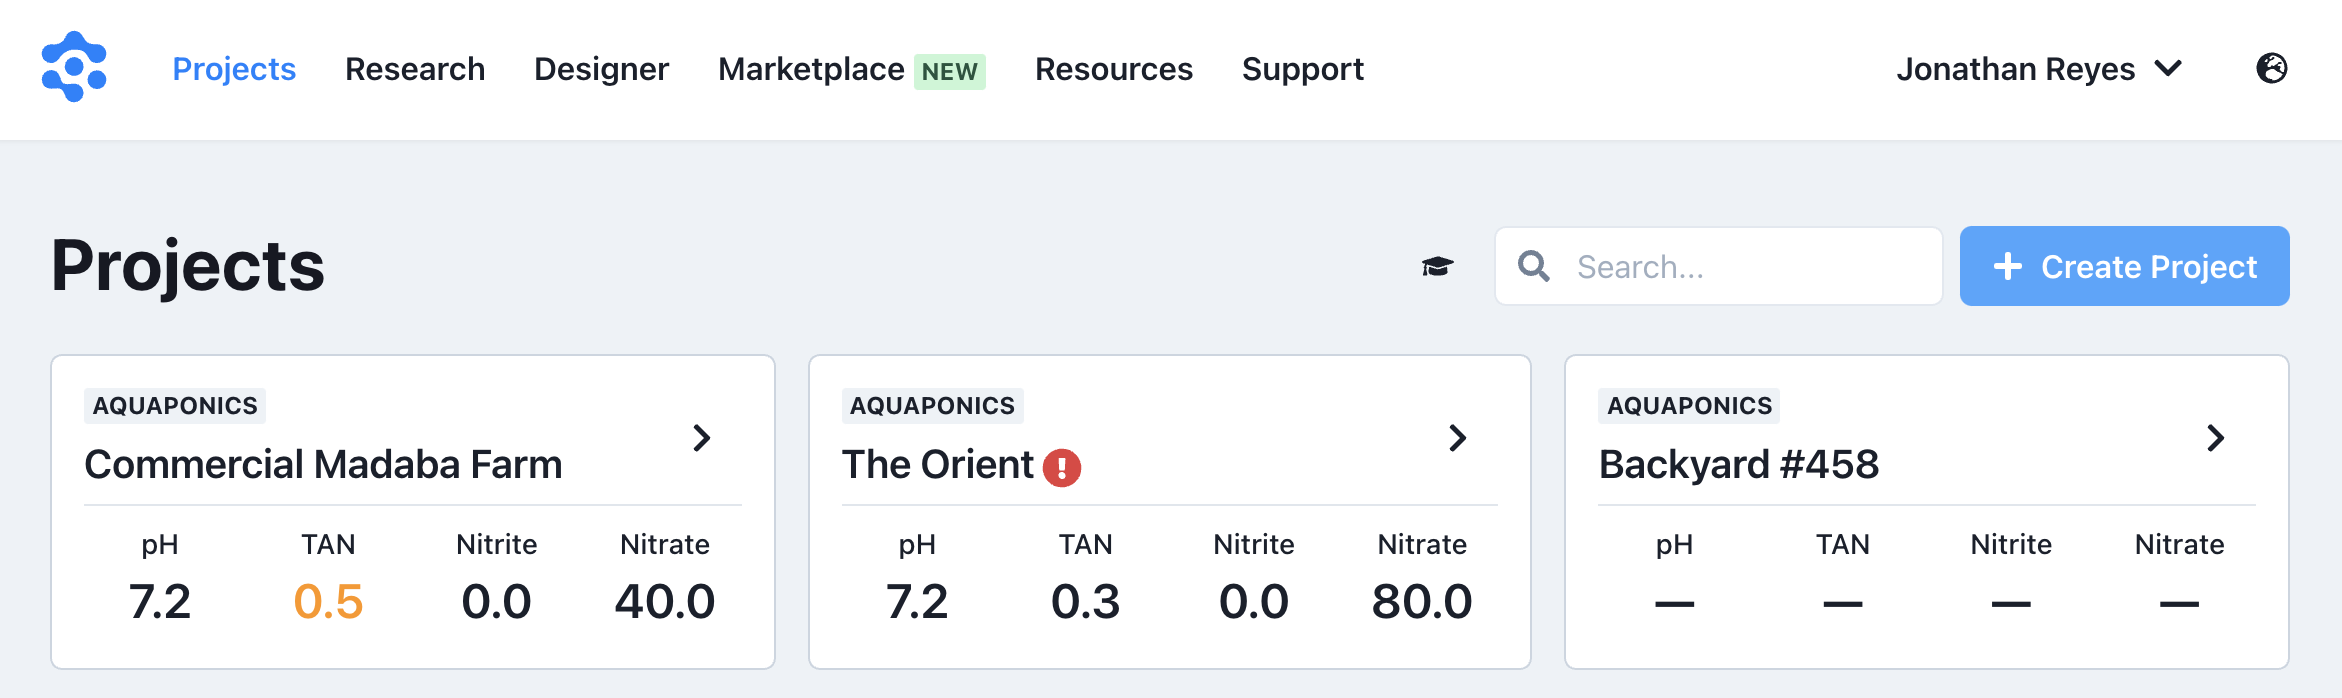
When you first log in you'll see a list of all the projects to which you belong. You'll also see key metrics from the project to get a quick overview of the system health without having to go into the individual project overview.
Project Dashboard
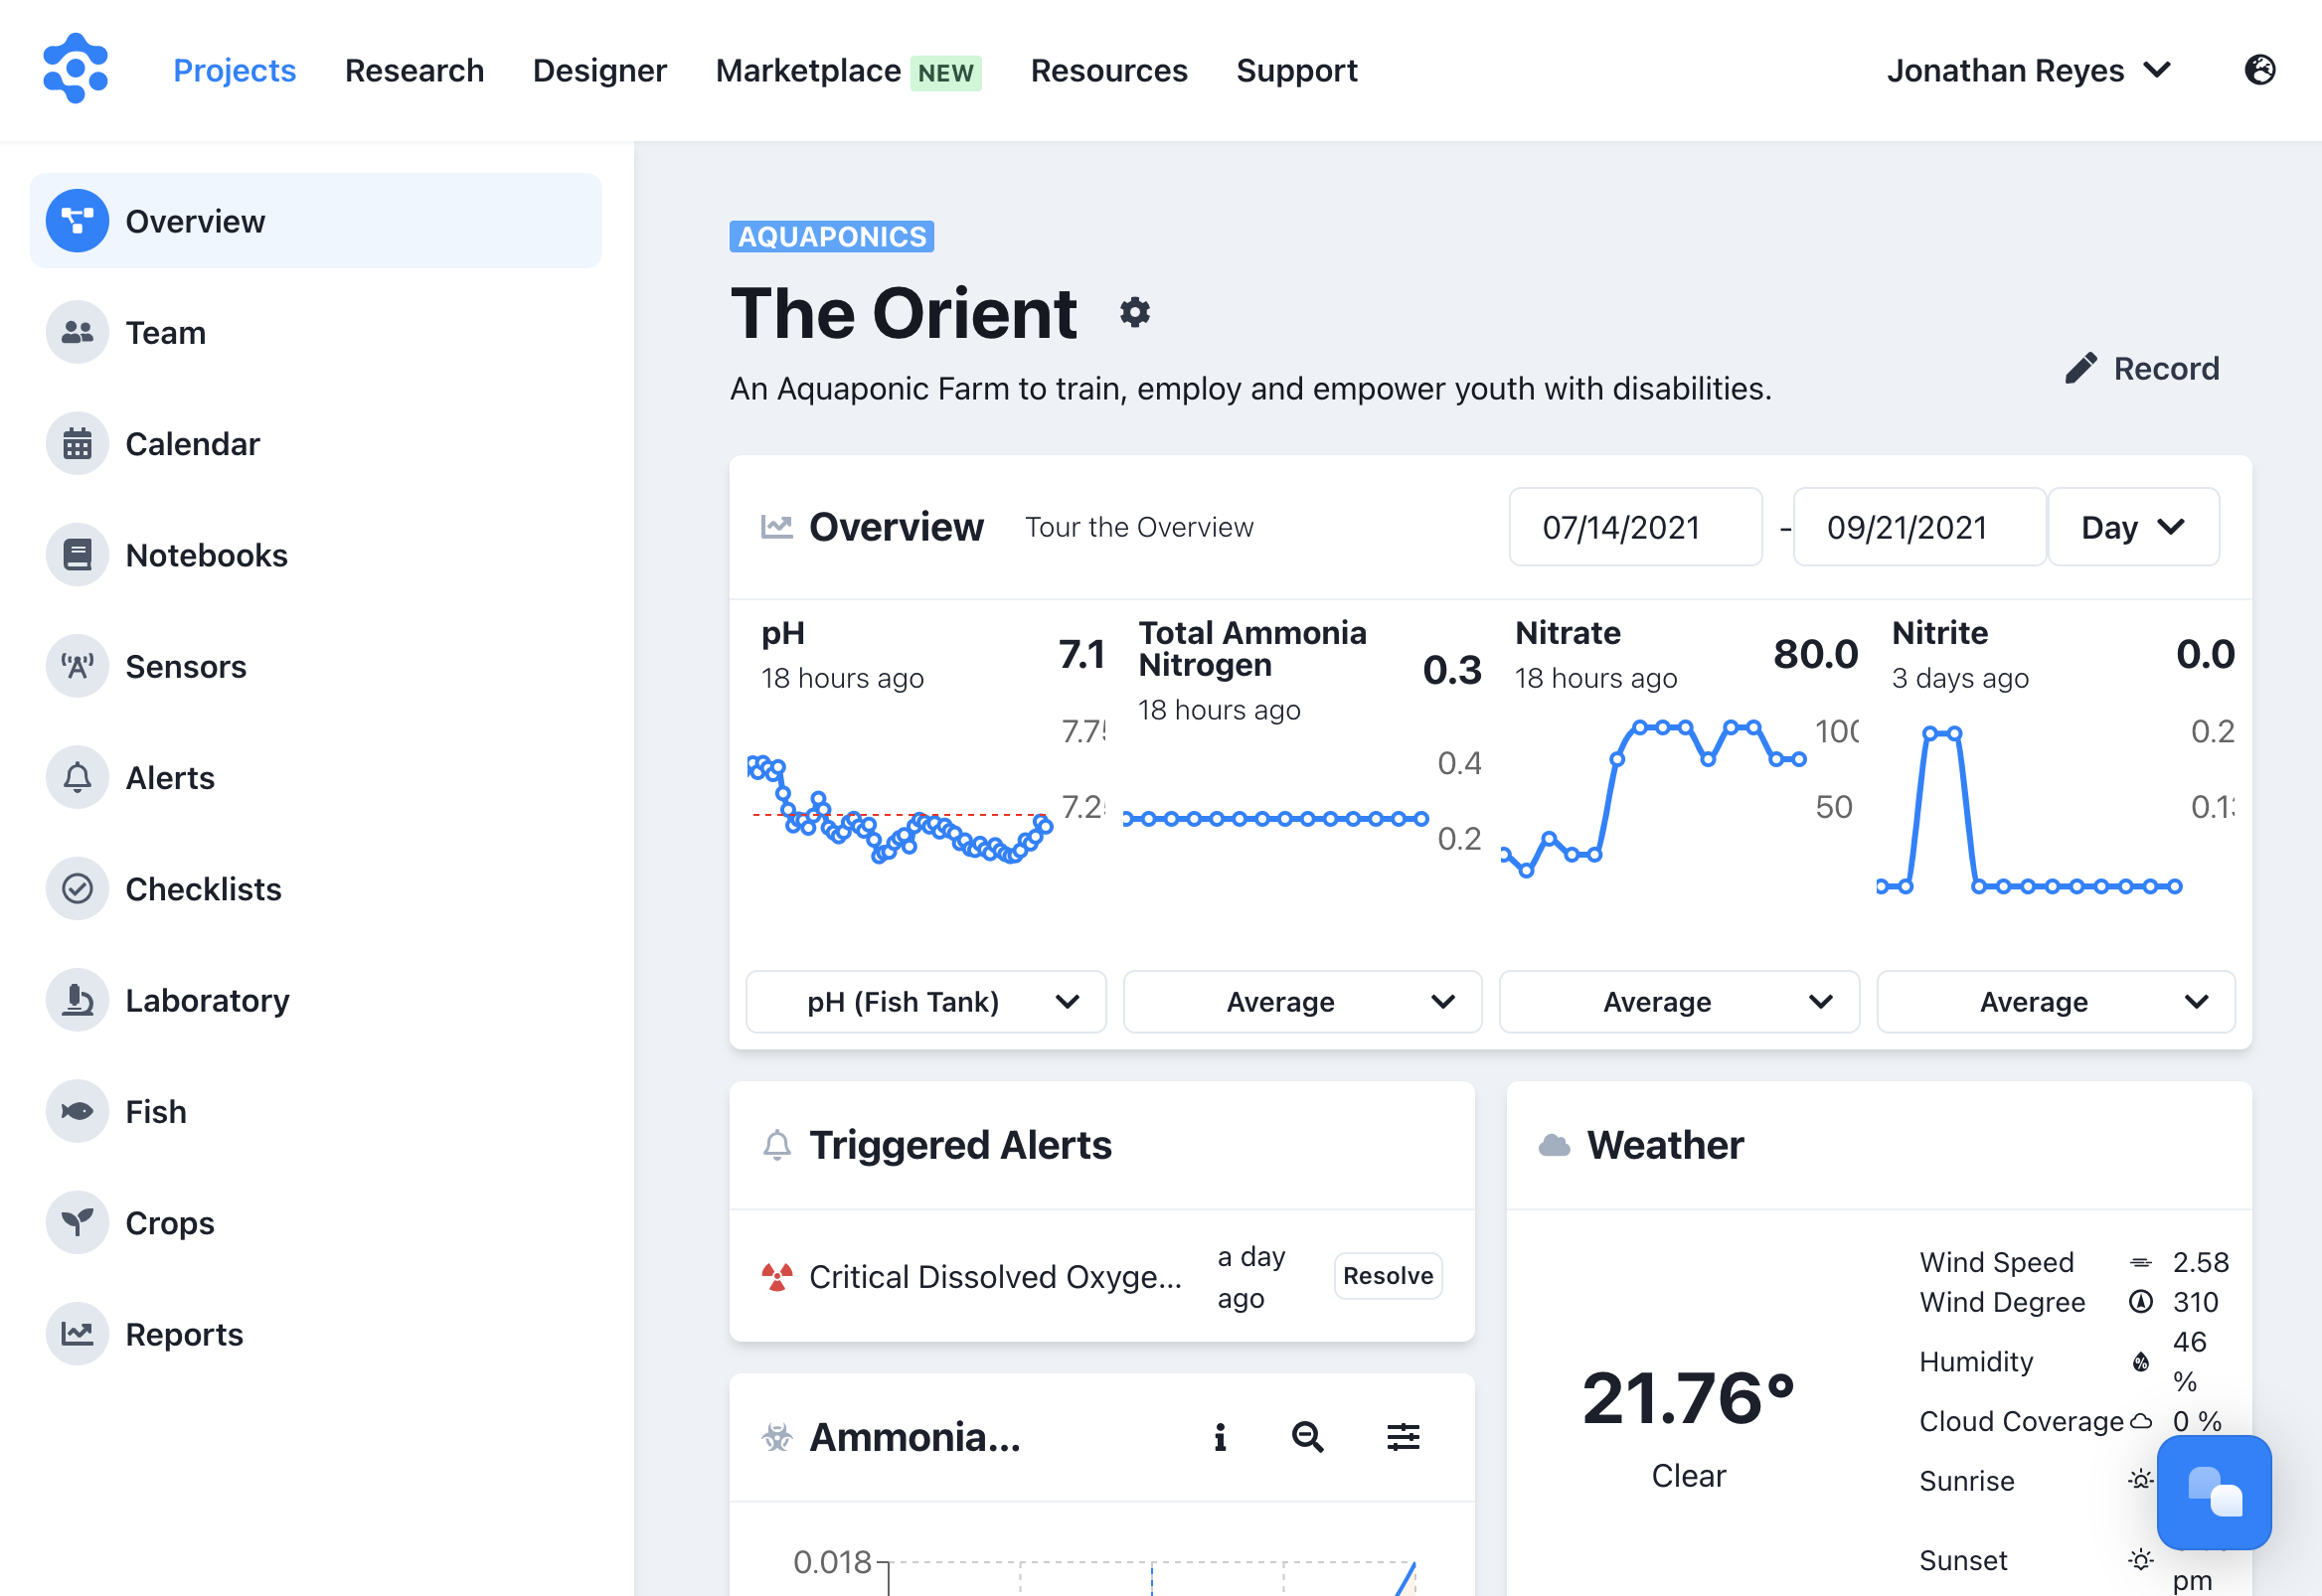
Most of your time will be spent within your project dashboard.
Selecting a project takes you directly to the project dashboard. This dashboard is jam-packed with VPD Charts, Nutrient Charts, weather data, cycling data, and much more. It's designed to give you everything you need to manage your system from a high-level overview.
Tips
The dashboard will look different for each of the project types (hydroponics, aquaponics, aquaculture).
Research Center
The research center is for quick research regarding common plants, fish and diseases. The libraries include general guidance for pH ranges, crop spacing, fish cultivation practices, etc.
Designer
The designer gives you the tools you need to understand complex calculations. You can visualize various components of your farm like DWC rafts, yield projections, and various ways to optimize your design.
Tips
You don't need to use the designer to set up your projects. This is an optional step and only if you want to try calculating or visualizing your system.
Marketplace
The marketplace has even more information, resources, and guidance from the world's leading experts in aquaponics, aquaculture and hydroponics. We'll cover this in more detail later.
Resources
The free resource library has everything you'll need to dig deep in the world of aquaponics. We've assembled, translated and indexed the top manuals for Aquaponics and made them available in article format. Please enjoy a good read and share with your friends!