Nutrient Availability Chart
Click here to watch a quick demo.
When you're running your aquaponics system you'll see lots of conversations on the interwebs about keeping your metrics within a specific range. That's helpful, however, it's critical that you understand why those are in place. Nutrients are one of those very important reasons and this is why we have re-imagined the nutrient uptake charts.
As you track your data we'll show you how your system is able to access different nutrients!
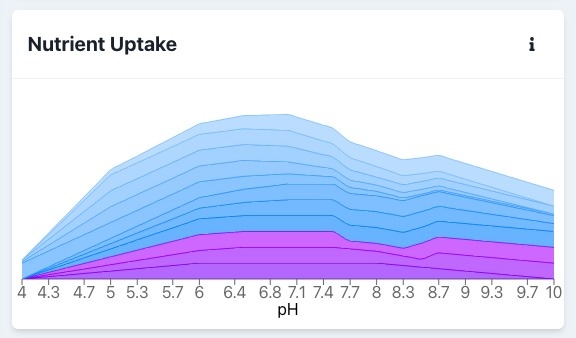
If you're looking to run your system between pH 6.8 and 7.2 you can see all the available nutrients for your plants. If you're struggling to keep your pH low and seeing lots of deficiencies, then you can troubleshoot and see which nutrients are lacking at those higher pH levels.
The purple colors represent the macronutrients nitrogen (N), phosphorus (P) and potassium (K). The micronutrients are represented by blue.