Ammonia Toxicity Chart
Click here to watch a demo of the chart
When you're tracking the ammonia in your system it is important to also know the TAN. This is the total ammonia nitrogen. This is the measurement of the NH3 (ammonia) and NH4+ (ammonium) in your system. Ammonia is toxic to your fish and it's critical to ensure that these values don't get too high. Fortunately the essential bacteria found in the water will convert this toxic form into less toxic forms like nitrate which is the driving force behind aquaponics.
To make sure your ammonia levels don't get too toxic we've create the Ammonia Toxicity Chart!
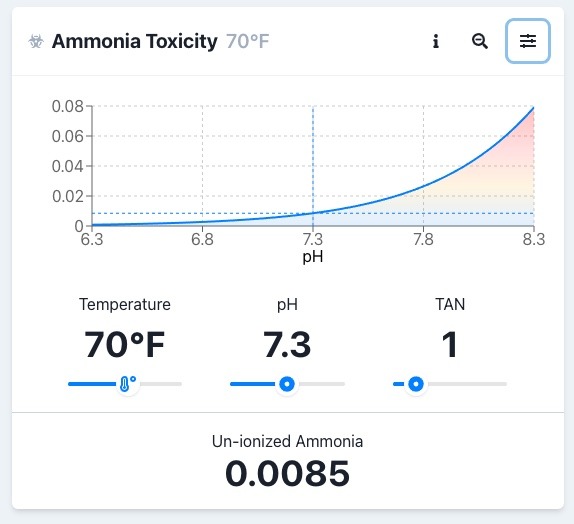
Based off your water quality parameters we will tell you exactly how much un-ionized ammonia is in your system. This is the metric you want to watch to ensure your levels aren't too toxic. You can see the orange and red values as that number increases.
If you're curious about how those numbers change based off temperature, ph, and total ammonia nitrogen, you can click the slider button in the top right and adjust them accordingly. You'll discover what happens in lower temperatures, higher temperatures and even when your ammonia spikes!